Ocean measurements, not a local weather forecast.
The tropical Pacific
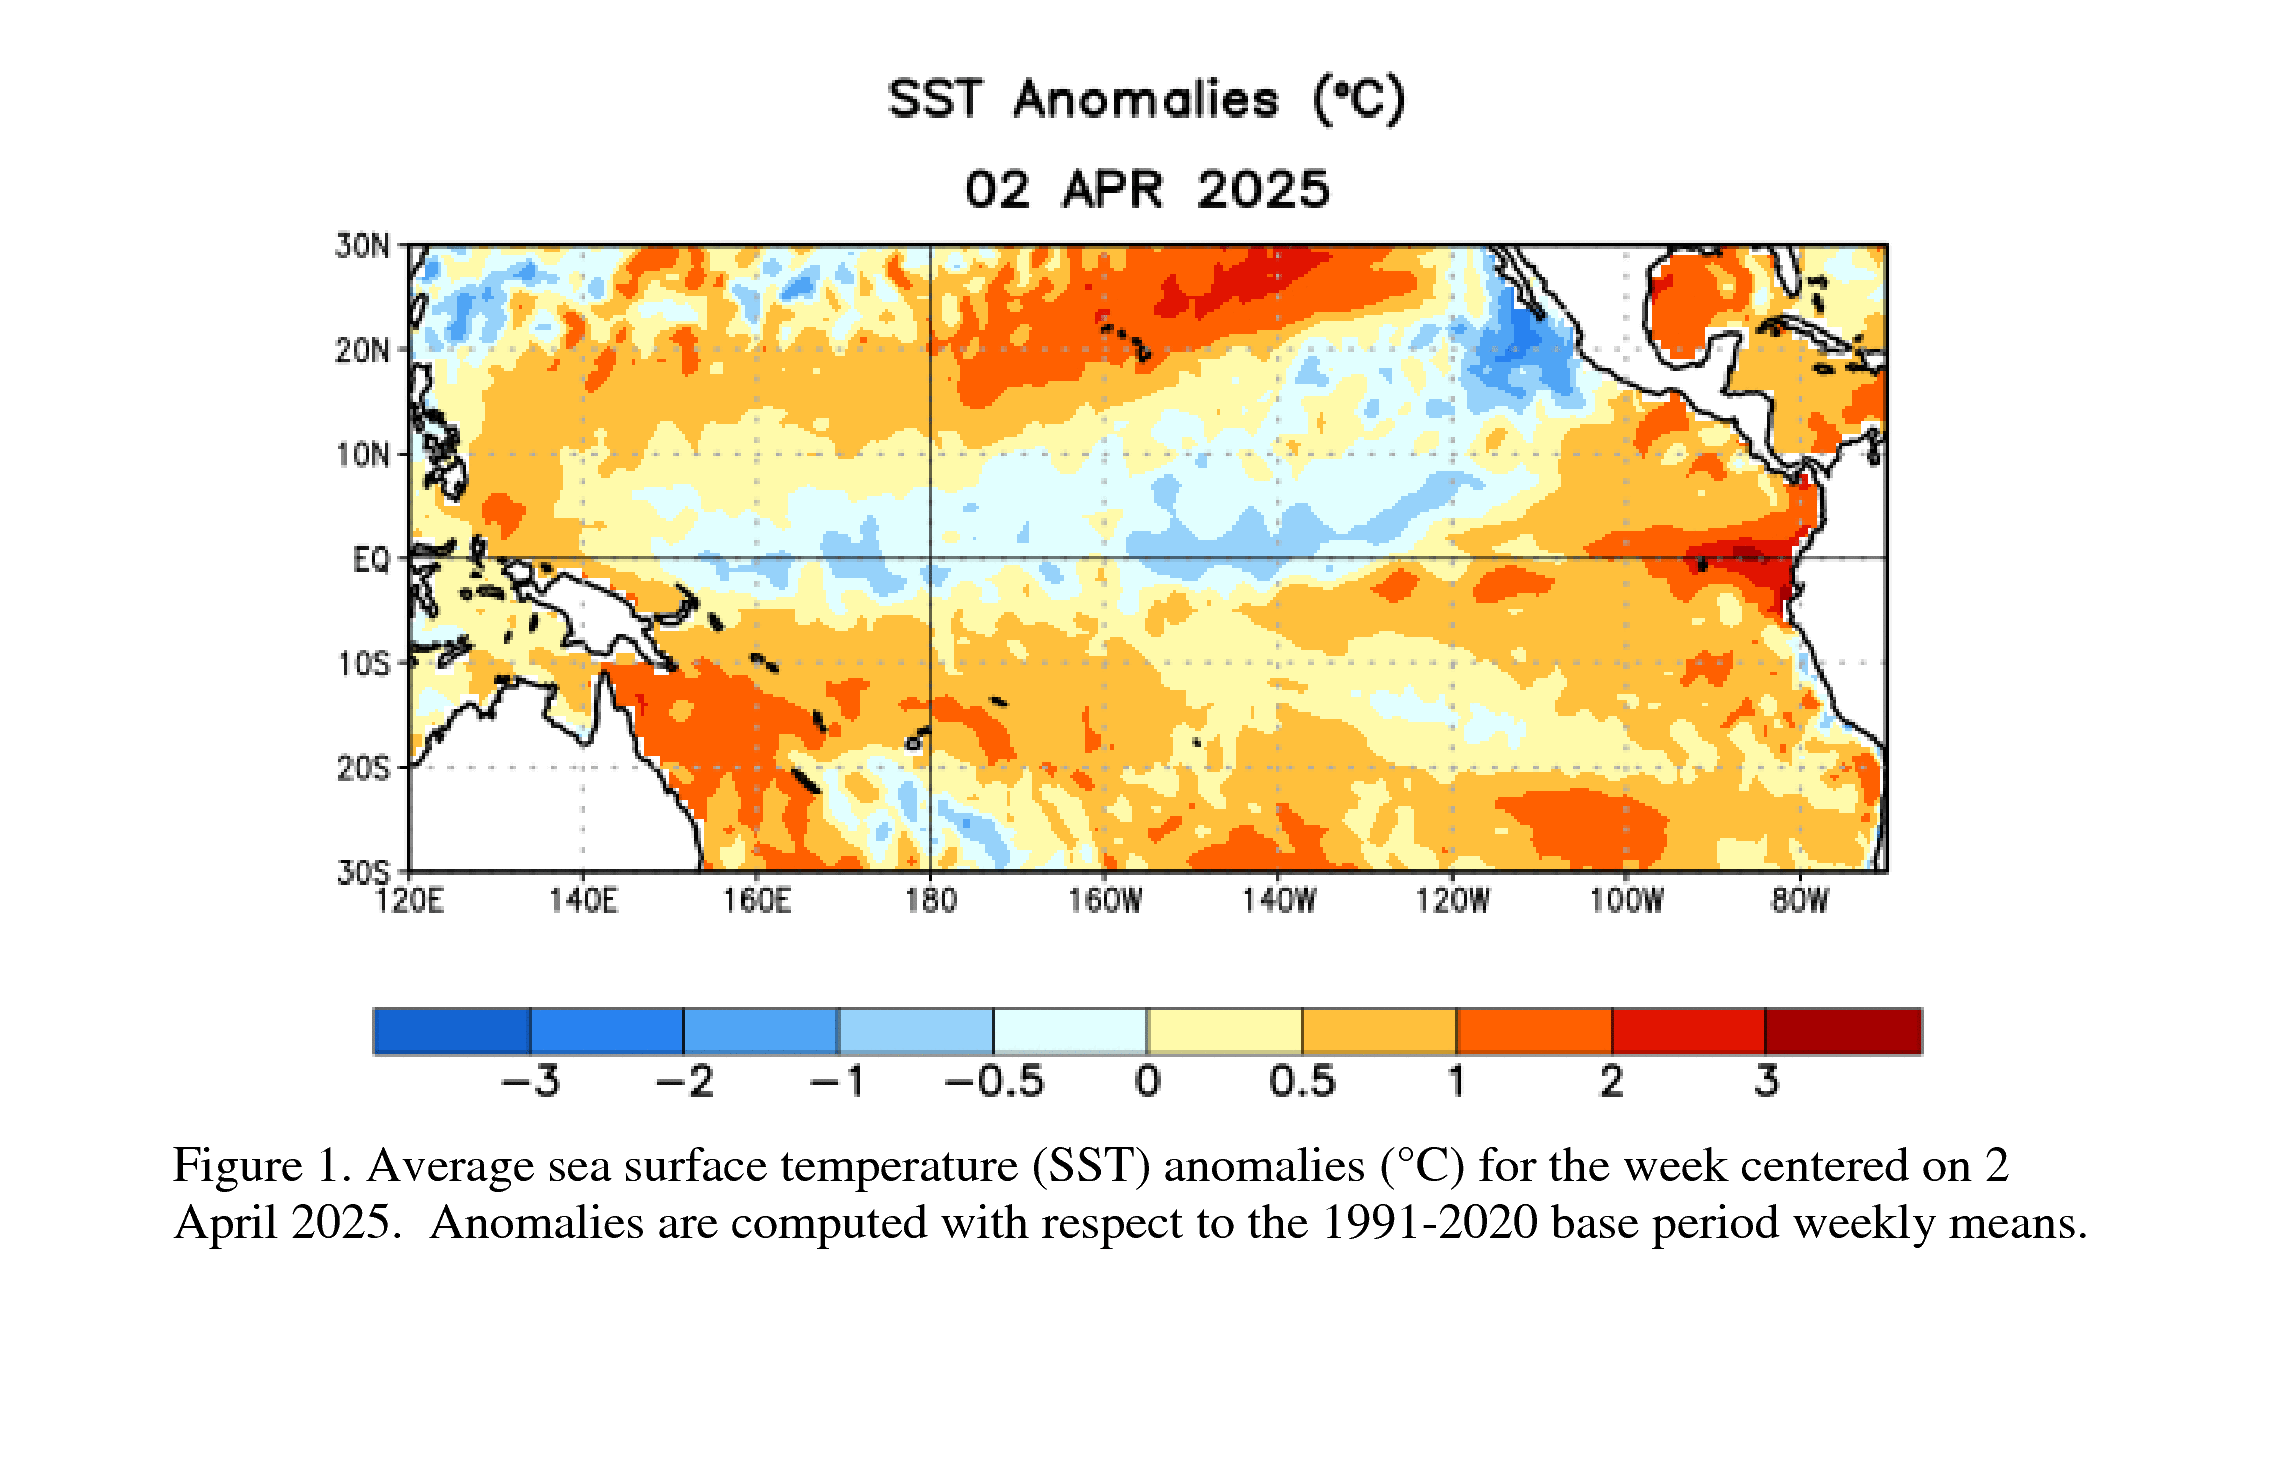
NOAA's latest published relative sea surface temperature map. Its observation period and scale appear in the graphic.
Relative Oceanic Niño Index
+1.97°CASO 2026 · overlapping three-month mean · °C
NOAA CPC · ERSSTv6 RONI data ↗
What does RONI measure?
The central Pacific temperature anomaly relative to the tropical ocean background, rescaled to preserve variance.
Region: 5°N–5°S, 170°W–120°W. Baseline: 1991–2020. Recent values can change for up to two months.
One value is not an ENSO declaration. NOAA also evaluates the atmosphere and persistence.
Method and official history ↗Across the Pacific
Relative SST anomalies · week centered November 11, 2026
Niño 1+2
+4.6°CNiño 3
+3.4°CNiño 3.4
+2.2°CNiño 4
+0.0°CEach chart shows the latest 52 weeks on the same −6°C to +6°C scale. Open the source table for exact values.
Ten years of RONI
Compare the current Pacific signal with previous seasons.
Index feeds checked November 17, 2026 at 18:02 UTC. These are observation periods, not real-time readings.
Outlook and other views
NOAA seasonal ENSO probabilities ↗